Technical analysis of stocks and trends is a study of historical trading data. Technical analysis, as the word suggests, may sound a bit complex to many of us. Just like mathematics and statistics are big aspects of the financial market, technical analysis helps in predicting future price movements by consistently assigning a fair market value to traded securities. Technical analysis is a trading discipline. If explained correctly, technical analysis is more sought.
It employs a measured investment as well as determining trading opportunities. The aforementioned is achieved by utilizing a statistical trend. Once you know that you can easily understand how to do technical analysis of stocks and trends.
Introduction To The Indian Stock Market
Indian Stock Market trading takes place on two primary stock exchanges: the National Stock Exchange (NSE) and the Bombay Stock Exchange (BSE). In fact, two Indian securities exchanges are the world’s fastest emerging markets in the world. Emerging markets like India are engines for future growth. Contrary, a very low percentage of household income is saved in India.
Fundamental and technical analysis courses are two popular approaches to analyzing stocks. Fundamental analysis aims to assess a stock’s intrinsic value by examining financial statements, economic indicators, and other qualitative factors. On the other hand, technical analysis focuses on price patterns and trends to predict future price movements. Using both forms of analysis can enhance investment strategies by providing a comprehensive view of the market.
Technical analysis of stocks is defined as an approach to evaluate price movement – using the study of past market data including price and volume to predict future price movements. Moreover, quantitative analysis and behavioral economics use similar technical analysis tools, relying heavily on price and volume data. Technical analysis also seeks to interpret market sentiment by analyzing price patterns and movements, a concept rooted in the historical foundations laid by Charles Dow.
Introduction to Technical Analysis
Technical analysis is a method of evaluating securities by analyzing statistical trends in trading activity, typically involving price movement and volume. It is used to identify trading and investment opportunities by scrutinizing the ways supply and demand for a security affect changes in price, volume, and implied volatility. Technical analysis assumes that past trading activity and price changes of a security can be valuable indicators of the security’s future price movements when paired with appropriate investing or trading rules. By focusing on historical price and volume data, technical analysts aim to predict future price movements and make informed trading decisions.
Fundamental Analysis vs. Technical Analysis
Fundamental analysis and technical analysis are two different approaches to evaluating securities. Fundamental analysis is a method of evaluating securities by attempting to measure the intrinsic value of a stock by studying everything from the overall economy and industry conditions to the financial condition and management of companies. Technical analysis, on the other hand, is a method of evaluating securities by analyzing price and volume data to identify trends and patterns that suggest how a stock’s price will move in the future. While fundamental analysis focuses on a company’s financial statements, management team, industry trends, and market conditions, technical analysis focuses on price and volume moves, bypassing the underlying company’s fundamentals. Both methods have their own merits and can be used in conjunction to gain a comprehensive understanding of a stock’s fair market value and potential price movements.
Three Pillars of Technical Indicators in Technical Analysis
Three pillars of technical analysis of stocks in India lays down the foundation.
- Price: The most essential area focused by an analyst to make a successful trade decision. For instance measure of profits and losses, a difference between buy and sell. Understanding price action, which represents the movement of prices over time, is critical for predicting future performance and making informed trading decisions. Price charts are integral for technical traders as they analyze these charts to predict price movements across various time frames. Different trading styles influence the choice of time frames, with short-term traders focusing on quick price changes while long-term investors might prioritize more extended trends.
Technical traders rely on past price data as an indicator of future market performance and utilize various technical analysis tools such as moving averages and Fibonacci retracements in their trading strategies. They analyze price charts across different time frames to make informed trading decisions, contrasting their methods with those of fundamental traders who may also use technical analysis to find optimal entry points.
- Volume: Volume includes major technical analysis concepts such as market breadth, trade count, open interest, accumulation, and distribution.
- Time: Time includes the relationship between patterns and trends, cycles, seasonality, and duration.
- Sentiment: Sentiment determines the consensus of investors.
Breaking Down Technical Analysis of Stocks Using Price and Volume Data
Let’s break down the technical analysis of stocks. The technical analysis of stocks has been used for hundreds of years. During the early 17th century, in Europe, Joseph de la Vega adopted a technical analysis approach to predict Dutch markets. Similarly, in Asia, Homma Munehisa influences the innovation of candlestick charts. This has become an incredibly popular technique to identify chart patterns in the West. Technical analysts focus on price and volume data displayed on stock charts to predict future movements, rather than assessing the company’s fundamental value.

The bottom line is that is the only method to predict market prices. This reflects all the available information that could impact a market. As a result, there’s a need to consider other tools available in the market. For instance economic, fundamental, and new development. Because they are previously priced as a disposal of security.
However, technical analysts believe that the movement of the price is directly related to trends. As well as history tends to repeat itself (when it comes to market).
There are two types of technical analysis: chart patterns and technical indicators.
- Chart patterns: Technical analysis charts of Indian stock is a subjective form to identify areas of resistance on the chart while looking at the specific patterns on the chart. The patterns help in predicting the price movement following a breakdown from a particular time. While a breakdown from this resistance is subject to a significant movement.
- Technical indicators: It’s a statistical form of technical analysis where an analyst applies several mathematical formulas to prices and volumes. However, moving averages is the most common type of technical indicator, used for spotting trends via smooth price data on a price chart.
Charting and Patterns
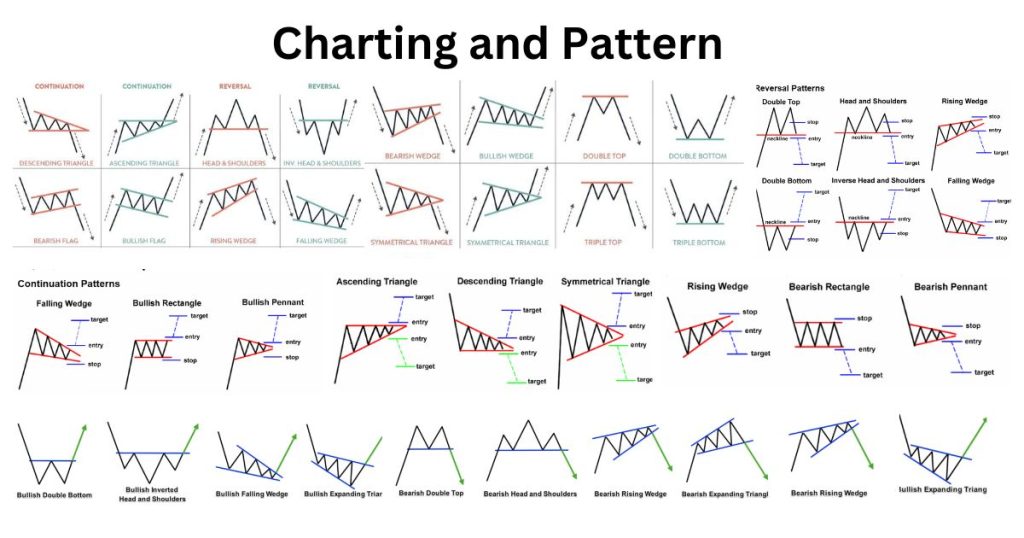
Charting and patterns are essential components of technical analysis. Technical analysts use charts to identify trends, patterns, and relationships between different financial instruments. Common types of charts used in technical analysis include line charts, bar charts, and candlestick charts. Candlestick charting is the most commonly used method of showing price movement on a chart. A candlestick is formed from the price action during a single time period for any time frame. Each candlestick on an hourly chart shows the price action for one hour, while each candlestick on a 4-hour chart shows the price action during each 4-hour time period. Chart patterns, which are formed by either a single candlestick or by a succession of two or three candlesticks, are some of the most widely used technical indicators for identifying potential market reversals or trend changes. By analyzing these patterns, technical analysts can make predictions about future price movements and develop trading strategies.

Trend Analysis
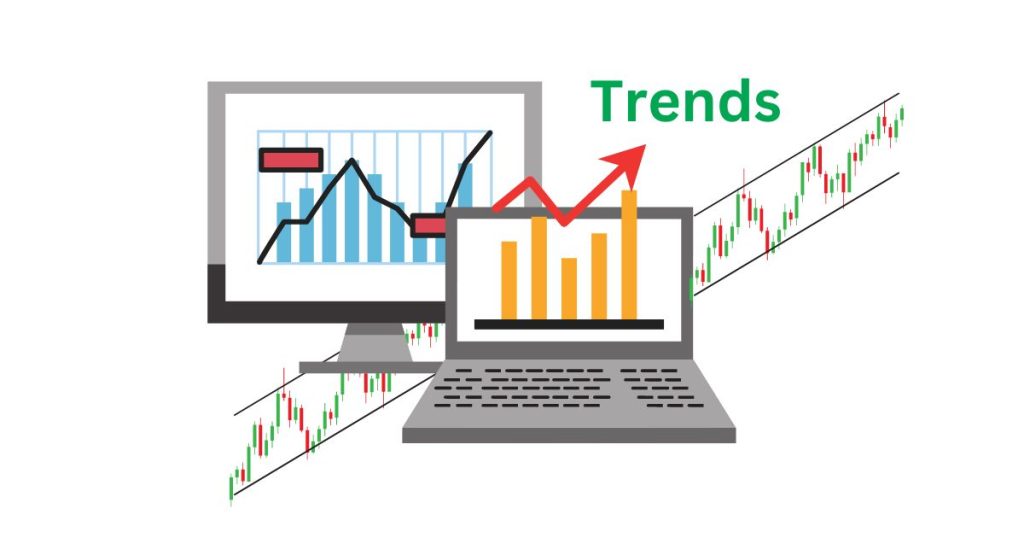
Trend analysis is a crucial aspect of technical analysis. Technical analysts use trend lines to identify the direction of a security’s price movement. Trend lines are used to identify and confirm trends in the market. A straight line is a trend line that joins two or more price points and then continues into the future to serve as a support or resistance line. Support lines are used to identify the price level at which a security’s price is likely to bounce back, while resistance lines are used to identify the price level at which a security’s price is likely to encounter resistance. Trend lines, support lines, and resistance lines can be used to identify potential buying and selling opportunities in the market. By understanding these trends, technical analysts can make more informed decisions about when to enter or exit a trade.
How To Do Technical Analysis of Stocks
In this section, we’ll discuss the technical analysis of the stocks on the basis of the indicators. Further, the technical indicators are classified as: qualitative and quantitative. The qualitative indicators aim to find support and resistance levels. Whereas the quantitative indicators aim to study price patterns and price movements in order to identify stock movement (upward or downward trend). Technical traders use various technical analysis tools such as moving averages and Fibonacci retracements to identify trading opportunities.
An analyst selects whether to buy stocks or not on the basis of the findings. Conversely, they include moving momentum and average indicators, which are part of the underlying technical analysis.
Qualitative Analysis
- Supports and resistance
- Chart patterns
- Change in polarity
Quantitative Analysis
- Identify market trends
- Momentum indicators
- Moving Averages
Advantages and Limitations of Technical Analysis
Technical analysis has several advantages, including its ability to identify trends and patterns in the market, provide entry and exit signals, and help manage risk. However, technical analysis also has some limitations. It can be subjective and may give conflicting signals, may not consider fundamental factors, and may not work in all types of market conditions. Additionally, technical analysis requires some skill and experience to use effectively. Despite these limitations, technical analysis remains a popular tool among traders, analysts, and investors, and can be used in conjunction with fundamental analysis to gain a more comprehensive understanding of the market. By combining both approaches, investors can leverage the strengths of each method to make more informed investment decisions.
Free Tutorial Technical Analysis of Stocks

Technical analysis of trading courses online free is a great way to improve learning. With the Institute of Financial Market Courses (IFMC), become an expert at analyzing both cues. The course will teach you the skills required to capitalize on stock trends like a pro trader. Understanding market sentiment can help in making more informed trading decisions by interpreting price trends. In addition, free technical analysis of Indian stocks analysis software. Fundamental analysis and technical analysis of equity stock is two methods of evaluating securities. Also, learn techniques to use complex chart analysis and advanced technical indicators. The course covers both technical and fundamental analysis, providing a comprehensive understanding of market evaluation.
NSE-NCFM Technical Analysis Module
Candle Chart Patterns: An Important Tool of Technical Analysis of Stock Market for Beginners


