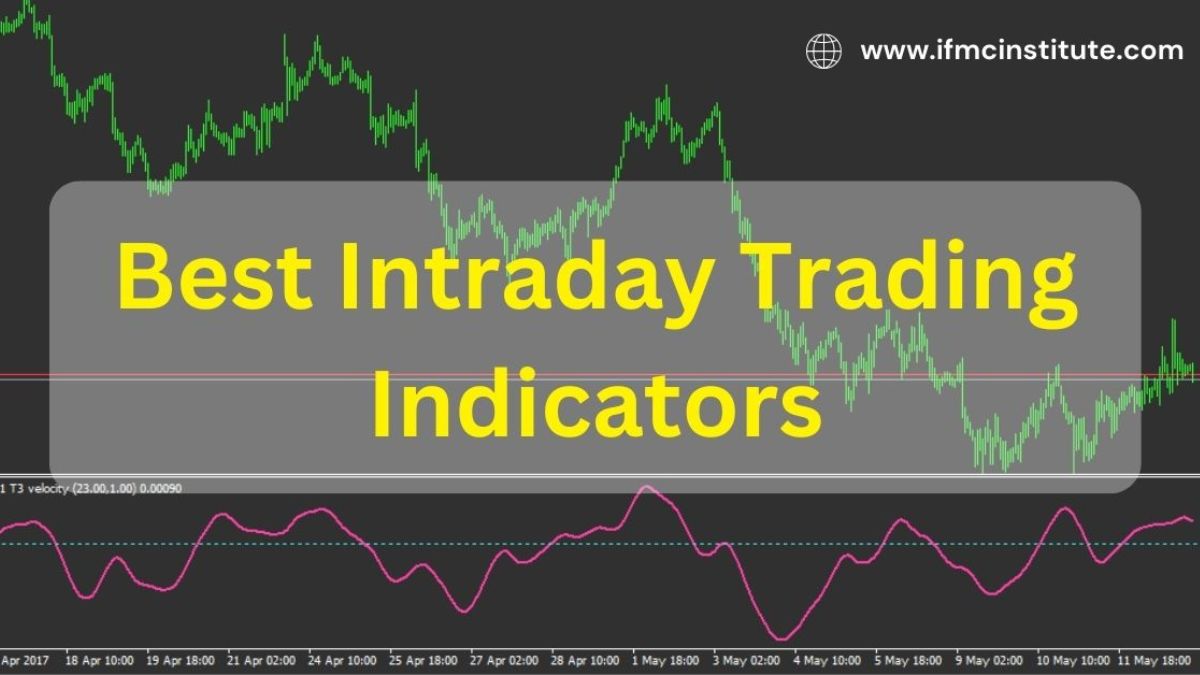
Many factors go into choosing the best indicator for intraday trading, but the three most important considerations are liquidity, price movement, and volatility. Liquidity is important because it ensures that there is enough activity to enable you to enter and exit trades quickly and at a fair price. Price movement indicates how much the price of the security is likely to move in a given period of time, and volatility measures how rapidly that movement is likely to occur. All else being equal, a security with higher liquidity, greater price movement, and higher volatility will be a better choice for intraday trading than one with lower liquidity, smaller price movement, and lower volatility.
What is an Indicator?
An indicator is a technical analysis tool that helps traders assess whether an asset is overbought or oversold. Most indicators are measured on a scale of 0 to 100, with 50 being the centerline and representing ” equilibrium “. When an indicator moves above or below 50, it is said to be in overbought/oversold territory. For example, the Relative Strength Index (RSI) is an indicator that measures how much an asset has gone up or down in price over a given period of time. When the RSI moves above 70, it is considered overbought and suggests that there may be a selling opportunity. Conversely, when the RSI falls below 30, it is considered oversold and may indicate a buying opportunity.
Combination of Moving Averages and RSI
When using technical indicators for intraday trading, it is important to use a combination of indicators that will give you the most accurate picture of the market. One popular combination is the use of moving averages and the Relative Strength Index (RSI). The moving average gives you a basic idea of the trend, while the RSI can help you determine when the asset is overbought or oversold. This combination can be helpful in making informed trading decisions intraday.
Volume in Reversal Strategy
When trading, it is important to pay attention not just to the price of the security, but also to the volume. The volume can give you clues about the strength of the trend and whether or not it is likely to reverse. In a reversal strategy, you want to look for high volume when the security is in an overbought or oversold state. This indicates that there is strong interest in the security and that a reversal may be imminent.
For example, imagine that you are looking at a stock that has been trending down for several days. The RSI indicator has been moving lower, indicating that the security is in oversold territory. You may want to consider shorting the stock when you see high volume as this could be a sign that the sellers are starting to outnumber the buyers and that the stock is likely to reverse direction soon.
Volume in Common Gaps
When looking at volume in common gaps, it is important to consider both the opening and closing volumes. The opening volume is the volume of shares that are traded during the first few minutes of trading, while the closing volume is the volume of shares that are traded at the end of the day. The closing volume is more important, as it indicates how strong the sentiment was at the end of the day.
If you are looking to trade a security that has formed a common gap, you want to pay attention to the closing volume. If the closing volume is high, it suggests that there was a lot of buying interest at the end of the day and that the gap may be filled soon. Conversely, if the closing volume is low, it suggests that there was little buying interest and that the gap may persist.
Which Time Frame Is Best For Intraday?
There is no definitive answer as to which time frame is best for intraday trading. It depends on the individual and their specific trading strategies. Some people find that trading shorter time frames (1 or 2 hour charts) gives them more opportunities to trade the markets, while others find that trading longer time frames (4 or 5 hour charts) allows them to better assess the overall market conditions and make more informed trades. Ultimately, it’s up to the trader to experiment with different time frames and see which one works best for them.
Is MACD Good For Day Trading?
MACD is a versatile indicator that can be used for day trading, swing trading, and even long-term investing. It’s one of the most popular indicators because it’s simple to use and provides a lot of information about the current state of the market.
MACD can be used to identify trend reversal points, support and resistance levels, and divergence patterns. When used correctly, MACD can give you an edge over other traders in the market. However, like all indicators, MACD should not be relied on 100% and should be used in conjunction with other technical analysis tools.
Volume
Volume is an important indicator for day traders to watch. It can help them identify trend reversals, support and resistance levels, and divergence patterns. When used correctly, volume can give traders an edge over other traders in the market. However, volume should not be relied on 100% and should be used in conjunction with other technical analysis tools.
RSI (Relative Strength Index)
The Relative Strength Index (RSI) is a technical indicator used in the analysis of financial markets. It calculates the magnitude of recent price changes to determine overbought or oversold conditions in a market.
RSI is calculated by taking the average of up to 14 days’ closing prices and dividing it by the standard deviation of those prices. The RSI is limited to values between 0 and 100, with readings below 30 indicating oversold conditions and readings above 70 indicating overbought conditions.
Moving Average Indicator for Intraday
The moving average indicator is one of the most popular indicators for intraday traders. It is a lagging indicator that smooths out price fluctuations to help traders identify trend reversal points and support and resistance levels.
There are different types of moving averages, such as simple, exponential, and weighted. The most popular type of moving average for intraday trading is the simple moving average, which is calculated by taking the average of a security’s closing prices over a given period of time.

When using a moving average indicator for intraday trading, it is important to choose the appropriate time frame. The time frame should be based on the trader’s trading strategy and the timeframe of the chart they are using. For example, if the trader is using a 1-hour chart, they would want to use a 5- or 10-period moving average. If the trader is using a 4-hour chart, they would want to use a 15- or 20-period moving average.
Volume in Running Gaps
A running gap is a type of price anomaly that occurs when there is a large difference between the prices of two consecutive days. A running gap is considered to be “running” because the market gaps in the same direction on both days.
Volume is an important indicator for day traders to watch when looking for running gaps. A high volume on the first day of the gap suggests that there is strong buying interest and that the gap may continue. Conversely, if the closing volume is low, it suggests that there was little buying interest and that the gap may persist.
How do trading indicators help?
Trading indicators help traders to measure the momentum of a particular security or market. They do this by identifying patterns in the price data of a given security or market.
There are many different types of trading indicators, and each one measures a different aspect of momentum. Some indicators measure trend strength, while others measure the speed at which prices are moving. Still others attempt to identify overbought and oversold conditions in the market.
Regardless of their individual functions, all trading indicators are designed to help traders make informed decisions about when to buy and sell securities or markets. By identifying positive and negative patterns in price data, trading indicators can help traders to enter into (and exit) trades at more opportune times.
Momentum Oscillators
Momentum oscillators are a type of technical indicator that measure the speed and magnitude of price changes. They are used to identify overbought and oversold conditions in a market, and to help traders make informed decisions about when to buy and sell securities or markets.
There are many different types of momentum oscillators, but the most popular ones are the MACD (Moving Average Convergence/Divergence) and Stochastic Oscillator.
The MACD is a histogram that is created by taking the difference between two exponential moving averages. The faster moving average is subtracted from the slower moving average. The resulting plot forms two lines: one that is positive and one that is negative. The MACD oscillates above and below these lines as the moving averages converge and diverge.
Best Indicators for Intraday Trading Indicators Introduction
There are a lot of different intraday trading indicators that traders use to make decisions about when to buy and sell stocks. While there is no perfect indicator, there are a few that are particularly well-suited for intraday trading. These indicators can help traders identify opportunities and make informed decisions about when to enter and exit trades.
One of the best indicators for intraday trading is the moving average convergence divergence (MACD). This indicator measures the relationship between two moving averages. When the MACD line crosses above the signal line, it is a bullish signal that suggests the stock is poised for an up move. Conversely, when the MACD line crosses below the signal line, it is a bearish signal that suggests the stock is due for a down move. The MACD is a highly effective indicator that can be used to make profitable trades in both rising and falling markets.
Another great indicator for intraday trading is the relative strength index (RSI). The RSI measures how overbought or oversold a stock is. A reading above 70 suggests the stock is overbought and may be due for a pullback. A reading below 30 suggests the stock is oversold and may be due for a rebound. The RSI can be used to generate accurate buy and sell signals in both uptrending and downtrending markets.
These are just two of the many indicators that can be used for intraday trading. By combining several indicators, traders can develop a comprehensive system that generate reliable buy and sell signals. Indicators are powerful tools, but they should only be one part of a trader’s overall strategy. Fundamental analysis, technical analysis, and risk management should all be considered before entering any trade.
What’s the Best Intraday Strategy for Beginners?
For beginners, we recommend a simple strategy that doesn’t require constant monitoring of the market.
First, find a stock you’re interested in and do some research on it. Look at the company’s website, annual reports, and recent news releases to get a sense of what the company is doing and where it’s headed.
Next, set a stop-loss order at a price that you’re comfortable with. This is an order that gets automatically executed when the stock reaches a certain price, so it can help you protect your investment.
Then wait for the stock to hit your buy point and place your order. You should have a plan for how much you want to invest and how often you want to buy/sell.
Lastly, monitor your position and adjust as necessary. Keep an eye on the company’s performance and the overall market conditions. Be prepared to exit your position if needed.
By following this strategy, beginners can minimize their risk while still participating in the intraday trading market. It’s also important to remember that no strategy is foolproof, and losses are always a possibility in trading. It’s important to stay informed and make educated decisions, but also be prepared for unexpected events. Happy trading!
Need for Intraday Indicators
Indicators are an important tool for any trader, but they should only be one part of a comprehensive trading strategy. Fundamental analysis, technical analysis, and risk management should all be considered before entering any trade. By using a variety of indicators, traders can develop a system that works best for them and helps them achieve success in the intraday market.
12 Best Technical Indicators for Intraday Trading in 2023
There are a number of different intraday trading indicators that can be used for intraday trading, and each one provides its own unique insights into the market. Some indicators focus on price data, while others include volume or momentum as well. The most effective intraday trading indicators are those that are simple to understand but still provide accurate buy and sell signals. Following 12 intraday trading indicators for intraday trading.
On Balance Volume
On balance volume (OBV) is a technical indicator that measures the cumulative flow of money into and out of a security. It is used to identify changes in investor sentiment and to predict future price movements.
The OBV indicator is calculated by adding the volume for a security for a given period and subtracting the volume for the previous period. This calculation is repeated for each period, and the OBV indicator is then plotted on a chart. A positive OBV reading suggests that more money is flowing into the security, while a negative reading suggests that more money is flowing out.
The OBV indicator can be used to generate buy and sell signals, and it is especially useful in identifying trend reversals. When the OBV trendlines cross, it is often considered to be a strong buy or sell signal. The OBV indicator can also be used in conjunction with other indicators to develop a more comprehensive trading strategy.
By using the OBV indicator, traders can get a better understanding of what’s happening in the market and make more informed trading decisions. It is an important tool to have in any trader’s arsenal.
Moving Average Convergence Divergence
The moving average convergence divergence (MACD) is a technical indicator that is used to identify changes in the momentum of a security. It is calculated by taking the 12-period and 26-period exponential moving averages (EMAs) of a security and plotting them as a histogram. The MACD line is then plotted on top of the histogram, and it is used to indicate buy and sell signals.
When the MACD line crosses above the signal line, it is considered to be a buy signal, and when the MACD line crosses below the signal line, it is considered to be a sell signal. The MACD histogram can also be used to identify overbought and oversold conditions.
The MACD indicator can be used in conjunction with other indicators to develop a more comprehensive trading strategy. By using the MACD histogram, traders can get a better understanding of what’s happening in the market and make more informed trading decisions.
Average Directional Index
The average directional index (ADX) is a technical indicator that is used to measure the strength of a security’s trend. It is calculated by taking the positive and negative directional indicators and averaging them together. The ADX is then plotted on a chart, and it is used to identify buy and sell signals.
A high ADX value suggests that the security is in a strong trend, while a low ADX value suggests that the security is in a weak trend. The ADX can also be used to identify trend reversals. When the ADX line crosses above the 50-line, it is considered to be a buy signal, and when the ADX line crosses below the 50-line, it is considered to be a sell signal.
The ADX indicator can be used in conjunction with other indicators to develop a more comprehensive trading strategy. By using the ADX indicator, traders can get a better understanding of what’s happening in the market and make more informed trading decisions.
Moving Averages
Moving averages are one of the most basic and commonly used technical indicators. They are simple to understand and can be used to generate buy and sell signals.
There are three types of moving averages: simple, weighted, and exponential. The most common type is the simple moving average, which is calculated by taking the average of a security’s closing prices over a given period of time.
The moving average indicator can be used to identify trends as well as trend reversals. When the moving average line crosses above the security’s price, it is considered to be a buy signal, and when the moving average line crosses below the security’s price, it is considered to be a sell signal.
The moving average indicator can be used in conjunction with other indicators to develop a more comprehensive trading strategy. By using the moving average indicator, traders can get a better understanding of what’s happening in the market and make more informed trading decisions.
Stochastic Oscillator
The Stochastic Oscillator is a momentum indicator that measures the location of the closing price relative to the high-low range over a given period of time. It is calculated by taking the percentage price change of a security over a given period of time and dividing it by the total number of periods. The resulting plot forms two lines: one that is positive and one that is negative. The Stochastic Oscillator oscillates above and below these lines as the security’s closing price moves closer to (or further away from) the high-low range.
Both the MACD and Stochastic Oscillator can be useful tools for day traders, as they can provide insight into overbought and oversold conditions in a market. However, it is important to remember that these indicators should not be used in isolation. It is best to use them in conjunction with other technical indicators and fundamental analysis.
Ultimately, the best indicator for intraday trading will vary depending on the individual trader’s goals and preferences. By carefully considering factors such as the type of information needed, level of complexity desired, and using indicators in conjunction with other analysis tools, traders can find the indicator that works best for them.
Supertrend
The supertrend indicator is a technical indicator that is used to identify uptrends and downtrends in a security. It is a trend-following indicator that is calculated by taking the average of the highs and lows over a given period of time. The resulting plot forms two lines: one that is positive and one that is negative. The supertrend indicator oscillates above and below these lines as the security’s price moves closer to (or further away from) the high-low range.
The supertrend indicator can be used to identify both short-term and long-term trends in a security. It is most effective when used in conjunction with other technical indicators, such as moving averages and MACD. By using multiple indicators, traders can get a more comprehensive understanding of what’s happening in the market and make more informed trading decisions.
Relative Strength Index
The Relative Strength Index (RSI) is a momentum indicator that measures the speed and change of price movements. It is calculated by taking the average of the closing prices over a given period of time and dividing it by the standard deviation of the same security’s closing prices over the same period. The resulting plot forms two lines: one that is positive and one that is negative. The RSI oscillates above and below these lines as the security’s price moves closer to (or further away from) the average closing price.
The RSI can be used to identify overbought and oversold conditions in a security. When the RSI reaches an extreme level (either above 70 or below 30), it is considered to be in overbought/oversold territory. This can be used to generate buy and sell signals.

The RSI is most effective when used in conjunction with other technical indicators, such as moving averages and MACD. By using multiple indicators, traders can get a more comprehensive understanding of what’s happening in the market and make more informed trading decisions.
Commodity Channel Index
The Commodity Channel Index (CCI) is a momentum indicator that measures the deviation of a security’s price from its statistical mean. It is calculated by taking the average of the security’s price over a given period of time and dividing it by the standard deviation of the security’s price over the same period. The resulting plot forms two lines: one that is positive and one that is negative. The CCI oscillates above and below these lines as the security’s price moves closer to (or further away from) its statistical mean.
The CCI can be used to identify overbought and oversold conditions in a security. When the CCI reaches an extreme level (either above 100 or below -100), it is considered to be in overbought/oversold territory. This can be used to generate buy and sell signals.
The CCI is most effective when used in conjunction with other technical indicators, such as moving averages and MACD. By using multiple indicators, traders can get a more comprehensive understanding of what’s happening in the market and make more informed trading decisions.
Advance Decline Line
The Advance Decline Line is a technical indicator that measures the number of stocks advancing minus the number of stocks declining. It is used to gauge the overall health of the stock market and to identify market trends. The Advance Decline Line can be used in conjunction with other technical indicators to generate buy and sell signals. For example, if the Advance-Decline Line is rising while the price of the stock index is falling, it may be a sign that the market is oversold and poised for a rebound. Conversely, if the Advance-Decline Line is falling while the stock index is rising, it may be a sign that the market is overbought and ripe for a correction. The Advance Decline Line is therefore an important tool for both short-term traders and long-term investors.
Bollinger Bands
The Bollinger Bands indicator is a technical indicator that is used to identify periods of high and low volatility in a security. It is calculated by taking the average of the security’s closing prices over a given period of time and dividing it by the standard deviation of the security’s closing prices over the same period. The resulting plot forms three lines: one that is positive, one that is negative, and one that is zero. The Bollinger Bands oscillate above and below these lines as the security’s price moves closer to (or further away from) its average closing price.

The Bollinger Bands can be used to identify whether a security is in a bullish or bearish trend. When the security’s price is near the upper band, it is considered to be in a bullish trend. When the security’s price is near the lower band, it is considered to be in a bearish trend.
The Bollinger Bands are most effective when used in conjunction with other technical indicators, such as moving averages and MACD. By using multiple indicators, traders can get a more comprehensive understanding of what’s happening in the market and make more informed trading decisions.


