Beginners often judge a stock by its price. A stock at ₹200 looks “cheap”, and a stock at ₹3,000 looks “expensive”. That is a mistake. Price is the number on your screen. Value is what the business is worth.
Warren Buffett put it simply. “Price is what you pay. Value is what you get.” He has repeated this idea in his letters since the early years of his partnership. You can see the line in archived letters as well as later reprints and summaries.
This guide explains price versus value in plain English. You will learn how to read basic ratios. You will see real numbers for Infosys, TCS, and Tesla. You will also see where Indian markets stand today. Then you will get a step-by-step checklist to practice value thinking. If you want deeper training, you can learn these skills inside IFMC Institute’s courses.
courses
• Classroom: certificate course stock market
• Online: certification stock market course online
- Price vs Value, the Core Idea
- Why value matters more than price
- Quick view of today’s market
- The three ratios beginners should master
- Case studies, when price misleads
- What the market as a whole tells you
- How to estimate value in 7 steps
- Common beginner mistakes
- Quotes to keep you grounded
- Quick FAQs
- Practice with these examples
- What this means for you
- Learn with IFMC Institute
Price vs Value, the Core Idea
- Price is set by buyers and sellers in the market right now.
- Value is the business worth based on earnings, assets, and growth.
- The gap between price and value is where you make or lose money.
Benjamin Graham, the father of value investing, taught margin of safety. Buy below value and give yourself room for error. His work in The Intelligent Investor remains the foundation.
Why value matters more than price
- Prices swing every day. Value moves with the business.
- Over time, prices tend to follow value.
- If you pay less than value, your odds improve.
- If you pay more than value, you need perfect growth to justify it.
Quick view of today’s market
Retail participation in India is at record highs. Demat accounts grew from about 3.6 crore in 2019 to roughly 19.4 crore in 2025. This means more first-time investors are entering the market. You must use a value lens, or you risk buying high and selling low.
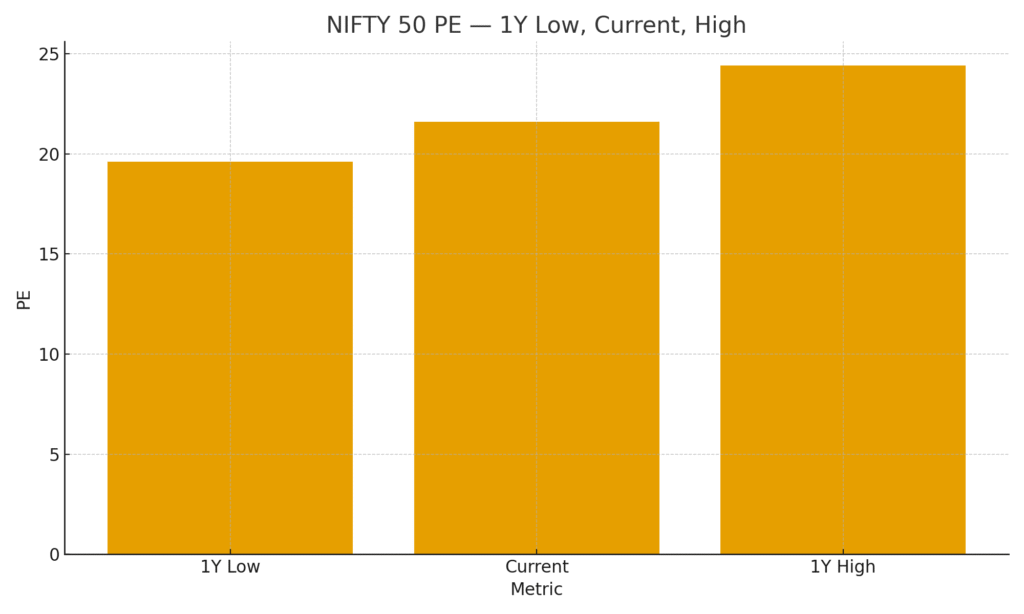
The NIFTY 50 price-to-earnings (P/E) ratio sits near the low 20s right now, within a one-year range of roughly 19.6 to 24.4. See the “NIFTY 50 PE” chart I prepared from public sources. You can check live ranges on Trendlyne, and a current snapshot on Screener’s NIFTY page.
The three ratios beginners should master
- P/E, price divided by earnings per share. Lower can be cheaper, but growth and quality matter.
- P/B, price divided by book value per share. Useful for asset-heavy firms.
- PEG, P/E divided by earnings growth rate. Near 1.0 implies P/E is in line with growth, far above 1.0 can be rich.
Real numbers, right now
I pulled current snapshots from Screener and other sources and created a simple table and charts. Use them to see how price can differ from value.
Infosys (NSE: INFY)
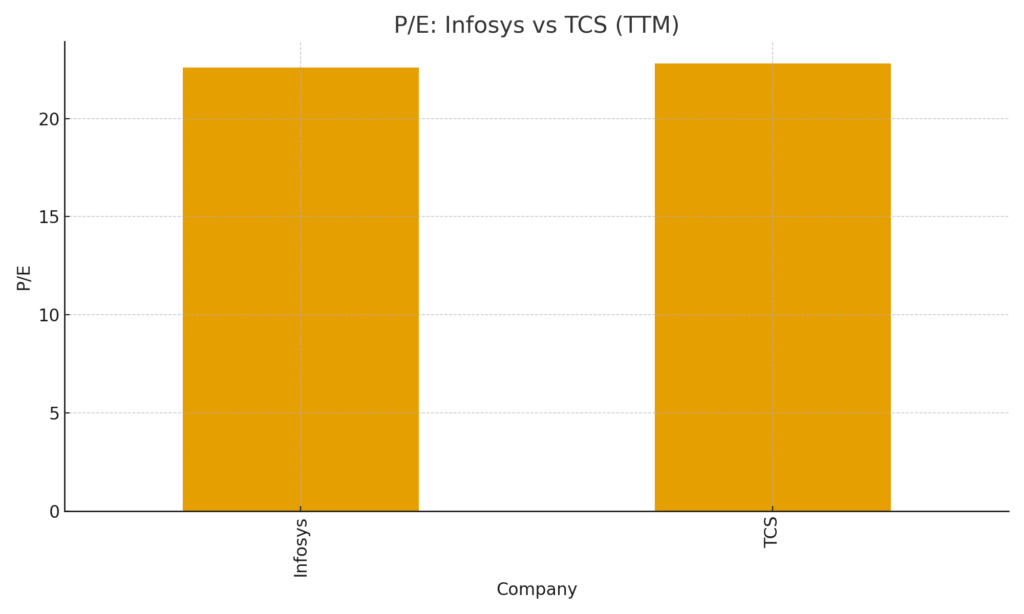
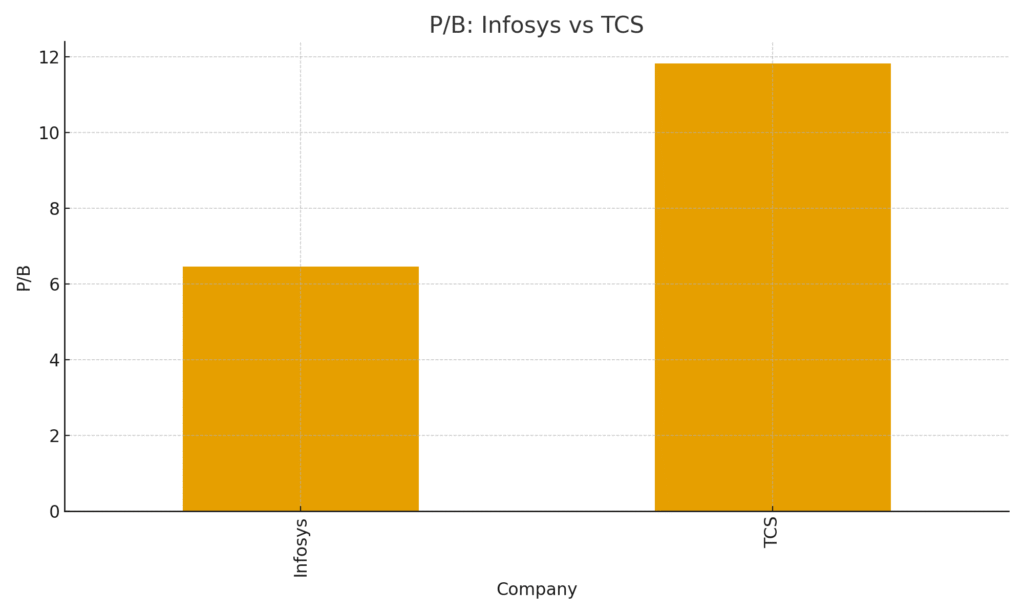
- Price ~ ₹1,479, P/E ~ 22.6, Book value per share ~ ₹229, which implies P/B ~ 6.46.
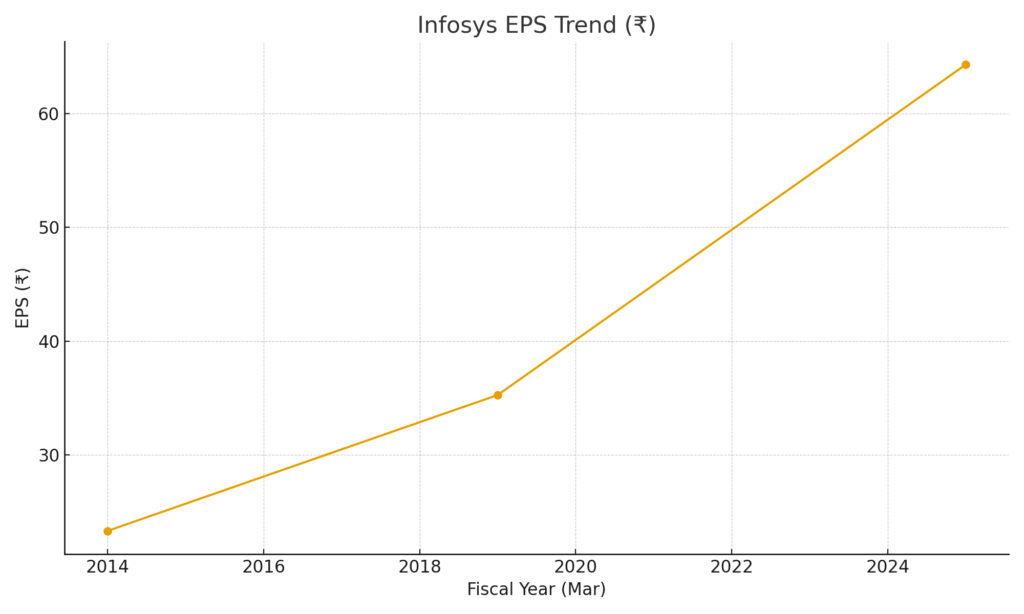
- EPS has grown from ~₹23.31 (FY2014) to ~₹64.32 (FY2025).
- Five-year compounded profit growth ~10 percent.
- Using that growth, a simple PEG = 22.6 / 10 ≈ 2.26.
Data source and page snapshot: Screener.
Tata Consultancy Services (NSE: TCS)
- Price ~ ₹3,098, P/E ~ 22.8, Book value per share ~ ₹262, which implies P/B ~ 11.8.
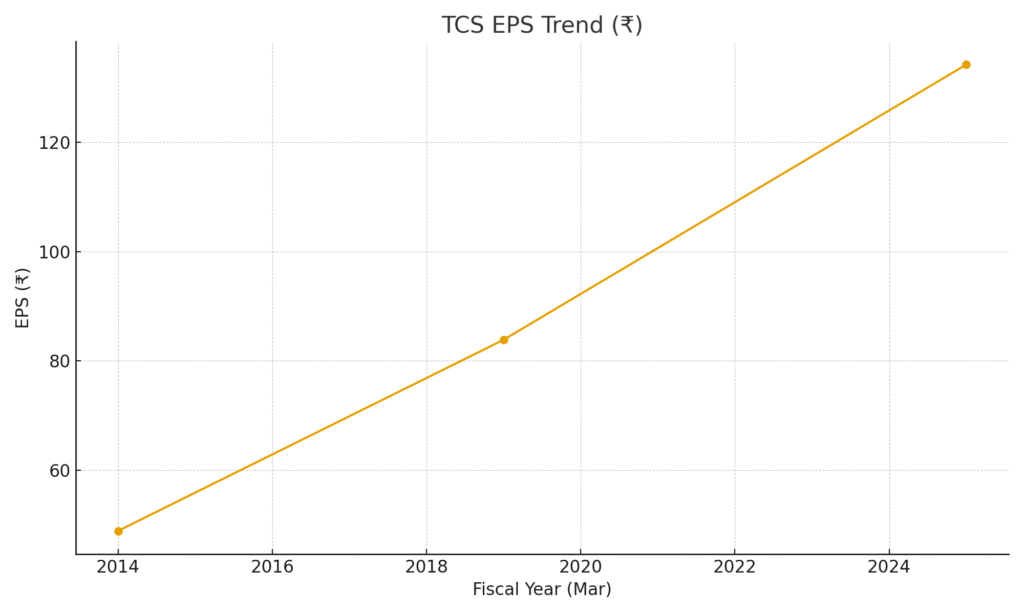
- EPS has grown from ~₹48.92 (FY2014) to ~₹134.20 (FY2025).
- Five-year compounded profit growth ~8 percent.
- PEG = 22.8 / 8 ≈ 2.85.
Data source and page snapshot: Screener and Moneycontrol ratios.
Tesla (NASDAQ: TSLA)
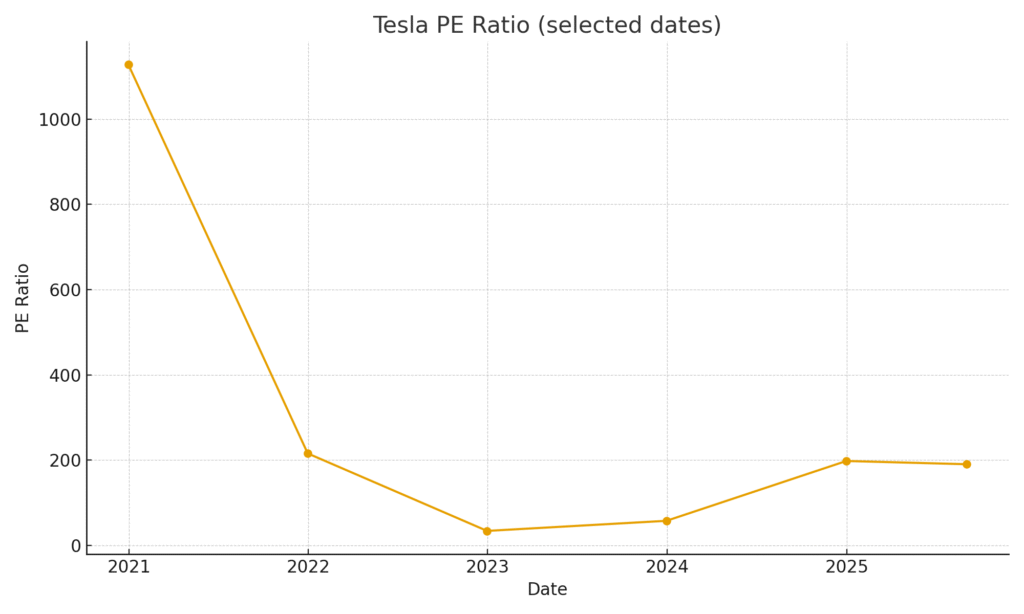
- P/E swings wildly. It stood near 198 at year-end 2024, and remains around the 190s in early September 2025.
- See the chart of selected dates that shows how the P/E collapsed to the 30s in 2022 then shot back near 200.
Data: Macrotrends.
You can view the bar charts for P/E and P/B of Infosys vs TCS here:
P/E chart,
P/B chart,
Case studies, when price misleads
1) Infosys, steady value creation
- EPS almost tripled from FY2014 to FY2025, from ~₹23 to ~₹64 per share.
- The stock P/E today is in the low 20s. That means you are paying about 22 times current earnings.
- If earnings keep growing near its five-year pace, value will likely keep rising, even if price wobbles.
See the Infosys EPS trend chart.
2) TCS, premium on quality
- EPS rose from ~₹49 to ~₹134 over the same FY2014 to FY2025 period.
- P/E sits near 23, P/B near 12, a stiff premium.
- The market often pays up for size, cash flow, and stability. You must judge if that premium is worth it.
See the TCS EPS trend chart and the Moneycontrol ratio panel for cross-check.
3) Tesla, price can detach from value
- Tesla’s P/E has swung from 30s to 1,100 to 200 within a few years.
- This shows investor expectations can outrun current earnings.
- High P/E can be fine if growth is real. It can also hurt you if growth slows.
See the Tesla P/E line chart I created from Macrotrends’ historical table.
What the market as a whole tells you
- The NIFTY 50 P/E one-year range sits roughly 19.6 to 24.4. Current is near the low 20s.
- At lows, more sound businesses may trade below value. At highs, you need more caution.
- Use ranges as context, not as a timing tool.
Sources: Trendlyne range and Screener NIFTY page.
How to estimate value in 7 steps
You can do this with free tools like Screener, NSE India, Moneycontrol, and company investor relations pages.
- Read the business
- What it sells, who it serves, and how it makes money.
- Screener’s “About” and “Segments” sections help.
- Look at earnings
- Check EPS trend for 5 to 10 years.
- Rising EPS usually supports rising value. Screener shows historical EPS rows.
- Check P/E and P/B
- Compare a stock’s P/E with its own history and its peers.
- Compare P/B for asset-heavy firms. TCS trades near 12 times book; Infosys near 6.5 times.
- Estimate growth and compute a rough PEG
- Use five-year profit growth as a simple proxy.
- Infosys PEG ≈ 2.26, TCS PEG ≈ 2.85 by our quick math. Values well above 1 can be rich if growth slows.
- Use a margin of safety
- Graham advised buying with a cushion below intrinsic value to reduce errors.
- Cross-check industry cycles
- Check index valuation context. Today NIFTY P/E is in the low 20s. It was higher at peaks. Use context to judge risk.
- Stick to facts, not headlines
- Focus on reports and audited numbers. Use Moneycontrol, company annual reports, and NSE/BSE filings for details.
Common beginner mistakes
- Buying a stock because it “fell a lot”, without checking earnings.
- Chasing a stock near 52-week highs only because it is “going up”.
- Ignoring P/E and P/B, then learning the premium was too high.
- Confusing a low price per share with a cheap company.
- Selling a good business because the price dipped for a quarter.
Quotes to keep you grounded
Warren Buffett: “Price is what you pay. Value is what you get.” Use it to filter hype.
Benjamin Graham, on margin of safety and investor discipline. Read or reference The Intelligent Investor for the core ideas.
Quick FAQs
Is a stock with a lower price always cheaper?
No. A ₹200 stock can be far more expensive than a ₹3,000 stock if its earnings are weak.
What is a good P/E?
It depends on the business and growth. Check the company’s own history and its sector. For context, NIFTY’s recent range is roughly 19.6 to 24.4.
Should I use PEG?
Yes, as a rough sense check. Use expected earnings growth if you have a reliable estimate. If not, use five-year profit growth as a proxy and be conservative.
How do I start learning this skill?
Take a structured course. Practice on large, well-known firms. Review each quarter. IFMC can train you step by step.
Practice with these examples
- Open Screener for Infosys and TCS. Note price, P/E, book value, EPS, and five-year profit growth. Cross-check with Moneycontrol’s ratio pages.
- Compare your numbers to my charts.
- Redo the same steps for one bank and one FMCG stock.
- Log your work in a sheet. Track results for six months.
What this means for you
- Stop judging a stock by its price per share.
- Judge by the business and the value you get for that price.
- Keep a margin of safety.
- Use simple ratios and a repeatable process.
- Learn, practice, and review.
Learn with IFMC Institute
You can master these basics in a structured way.
- Join the certificate course stock market if you prefer classroom learning.
- Prefer online learning, with flexibility. Take the certification stock market course online.
- Want a dealing desk role later. See equity dealer certification.


